It is a common question to probe as to where would the Sensex be say in 5, 10 or 20 years. Currently Sensex is trading around 29,000 levels and its historic peak was 29,681 achieved on January 29, 2015.
To cut a long story short, let me tell you first my findings and launch into explanation later. I expect Sensex to touch 52,000 by 2018 and reach 110,000 levels by 2025.

Source: Reuters Eikon; BSE, Author estimates
Sensex had a modest beginning in 1978 when it was launched with a base value of 100. Granular level data is available only from 1991 in the Bombay Stock Exchange website. In the 90’s it crossed 1,000 and in the 2000’s it crossed 4,000. In its 36 year history, Sensex averaged an annualized return of 16.9% outclassing all other asset class performance.

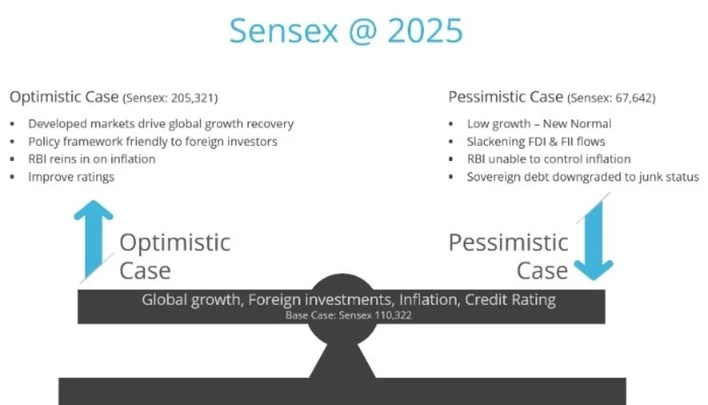
While the base case call for Sensex in 2025 is circa 110,000, the optimistic call could be 205,321and pessimistic call could be 67,642. The situation in which such optimistic or pessimistic scenarios could unfold is explained later. The base case call of 110,000 implies an annualized performance of 14.9% between 2015 and 2025 compared to 16.8% achieved during the last 10 years.

The period from 1980 to 2000 can be classified as “lost decades” where average economic growth (measured in real GDP) was below 6% with high inflation. Even under such circumstances, Sensex performance was exemplary especially during the decade of 1981-90 where the annualized growth in Sensex was nearly 22%. The decade of 2001-2010 can be termed “golden” with economic growth averaging 7.5%, inflation benign at 6.4% and Sensex performance was nearly 18%p.a. Viewed in this context, the call of 110,000 for Sensex by 2025 implies an annualized performance of 14.9% where economic growth is expected to average 6.6% with inflation at close to 6.5%.

The projection methodology
Historical values (closing price, P/E, div yield, P/BV, earnings, book value and dividends) from 1991 to 2014 were taken from BSE website.
Base case scenarios were considered based on historical averages.
Ratios (P/E, P/B & dividend Yield) were projected based on their respective historical averages. For example, P/E ratio in ensuing 4 years was considered to be average of past 4 years (2014-2011) P/E and so on.
In order to project future values an upside of 25% (optimistic) and downside of 25% (pessimistic) was considered for the parameters (ratios, earnings growth, div.& book value growth) under consideration.
Based on the various scenarios (optimistic, base case & pessimistic) the future values were computed.
The Drivers

There are two primary drivers and two ancillary drivers for Sensex. The main primary driver is the economic/business cycle. According to Pami Dua and Anirvan Banerji[1], the Indian business goes through peaks and troughs. Normally the duration from peak to trough is relatively much smaller compared to trough to peak. In the Indian context, the duration of peak to trough lasts for approximately one year while the duration of trough to peak lasts for 4.3 years yielding total cycle duration of 5.25 years. The path of peak to trough is marked by recession leading to curtailment of investments and therefore negatively impacts company earnings and stock price performance. The path of trough to peak is accompanied by growth leading to capital investment and will normally witness earnings expansion. Hence economic/business cycle tend to impact earnings either positively or negatively depending on the nature of the cycle.
The second most important driver for Sensex would be the earnings, through which we derive in what is most famously followed metric called P/E ratio. The P/E ratio can move higher either because of increase in market price (numerator) or because of decrease in earnings (denominator) and vice-versa. As we can decipher from the chart, the P/E for Sensex ranged from a high of 45 in 1994 to a low of 12 in 2008 with a mean of 21. Episodes of bull market will magnify the P/E and take it to over valuation levels while bear markets produces subdued P/E. The key driver to the P/E ratio is the earnings (the denominator) which has shown remarkable progress during the period since 1991. Sensex earnings have since grown from a modest 85 in 1991 to 1,460 in 2014 implying an annualized growth of 13%.

Source: Reuters Eikon; BSE
Another key stock market metric is the price to book ratio (P/B). The book value (denominator) is defined as the total net worth which includes both equity as well as accumulated reserves (the portion that is retained in the business and not distributed as dividends). Book value growth is concomitant on earnings growth. Historically the P/B ratio hit a high of 6.54 (2007) and a low of 2.2 (2002) with a mean of 3.70. The book value rose from a modest 533 in 1991 to 9,290 in 2014 implying an annualized growth of 13%.
And finally the dividend yield which is simply dividends divided by the market capitalization. Higher dividends or lower market capitalization can improve the yield and vice-versa. Business that have experienced growth will be loath to increase dividends as they feel that money can be better served in the business than in the hands of investors. Mature companies tend to favor higher dividends as they find fewer opportunities to redeploy earnings. The dividend yield fluctuated from a low of 0.68 (1994) to a high of 2.18 (2002).
Factors that can influence the Scenarios
In my assessment, there are some key factors that will influence the performance of Sensex in the next 10 years i.e., global growth, foreign investment, and inflation. In a globalized and networked world, the performance of the global economy (especially the developed world) will have a great significance on the performance of emerging markets like India. The jury is still not out on whether global growth has stabilized. Thanks to the global financial crisis, leading multilateral agencies (like IMF and World Bank) have been continuously revising the global growth outlook on the downside. There is a predominant view that global growth has settled to a “new normal” low and high growth rates are a thing of past. India’s stock market performance is significantly dependent on whether global growth will stabilize and pick up (the optimistic case) or will falter and fail (pessimistic case).
The second factor is the foreign investment both on infrastructure investment (FDI) and portfolio investments (FII). India’s track record on this has been dismal so far especially when benchmarked with China. However, the new Modi government’s focus on this can produce some change. We see them working on foreign investment friendly policies. If the government can implement all the promised reforms in this area, it can unleash the optimistic scenario. However, it is also possible that politics will dominate economics here and India may continue to pursue “unfriendly” foreign investment policies which will produce the pessimistic scenario.
The third factor is inflation, which is an enemy for stock market performance. India is a high inflation economy thanks to supply side bottlenecks and over reliance on oil imports. While we saw some relief in the second aspect of oil price, the first one will require serious reforms to tackle. India is blessed with an independent central bank whose obsession to reduce inflation is commendable. However, persisting high inflation will be viewed very negatively by investors (read foreign) and may unleash the pessimistic scenario. However, if RBI and the government succeed in taming the inflation (which looks like positive so far), then we may be in for a pleasant surprise in terms of stock market performance.
The final word
Equity as an asset class has always performed far better than other alternatives but with only one caveat i.e., volatility. What has been discussed and shown in this article is only the return side of the story. However, the risk that one has to take to achieve these returns is also equally significant. A simple tool to measure risk is the standard deviation but there are other equally important measures of risk as well. Equity is one asset class which will dissuade investors from holding on due to its inherent volatility. Investors that can stomach this volatility and hold on to the investment can certainly reap the benefit. However, studies have repeatedly shown that investors show scant tolerance to holding up their equity investments and make erroneous entry and exit decisions that are harmful to their performance. In other words, they time their investments mostly wrongly leading to underperformance. Technology has enabled investors to buy the market (read Sensex) through cost effective solutions in the form of exchange traded funds (ETF’s). All one has to do is to invest in the ETF and ride through the time without getting distracted. Difficult isn’t?
[1] Business Cycles in India (2006)
PS: The author thanks Rajesh Dheenathayalan for his assistance