Equity Investment Styles - Size Matters

This Article was originally published in The Global Analyst
This may sound like a birth of a baby growing into a full blow adult eventually hit by old age and gracefully dying! Yes, the story of a company in a stock market is also very similar to this narrative.
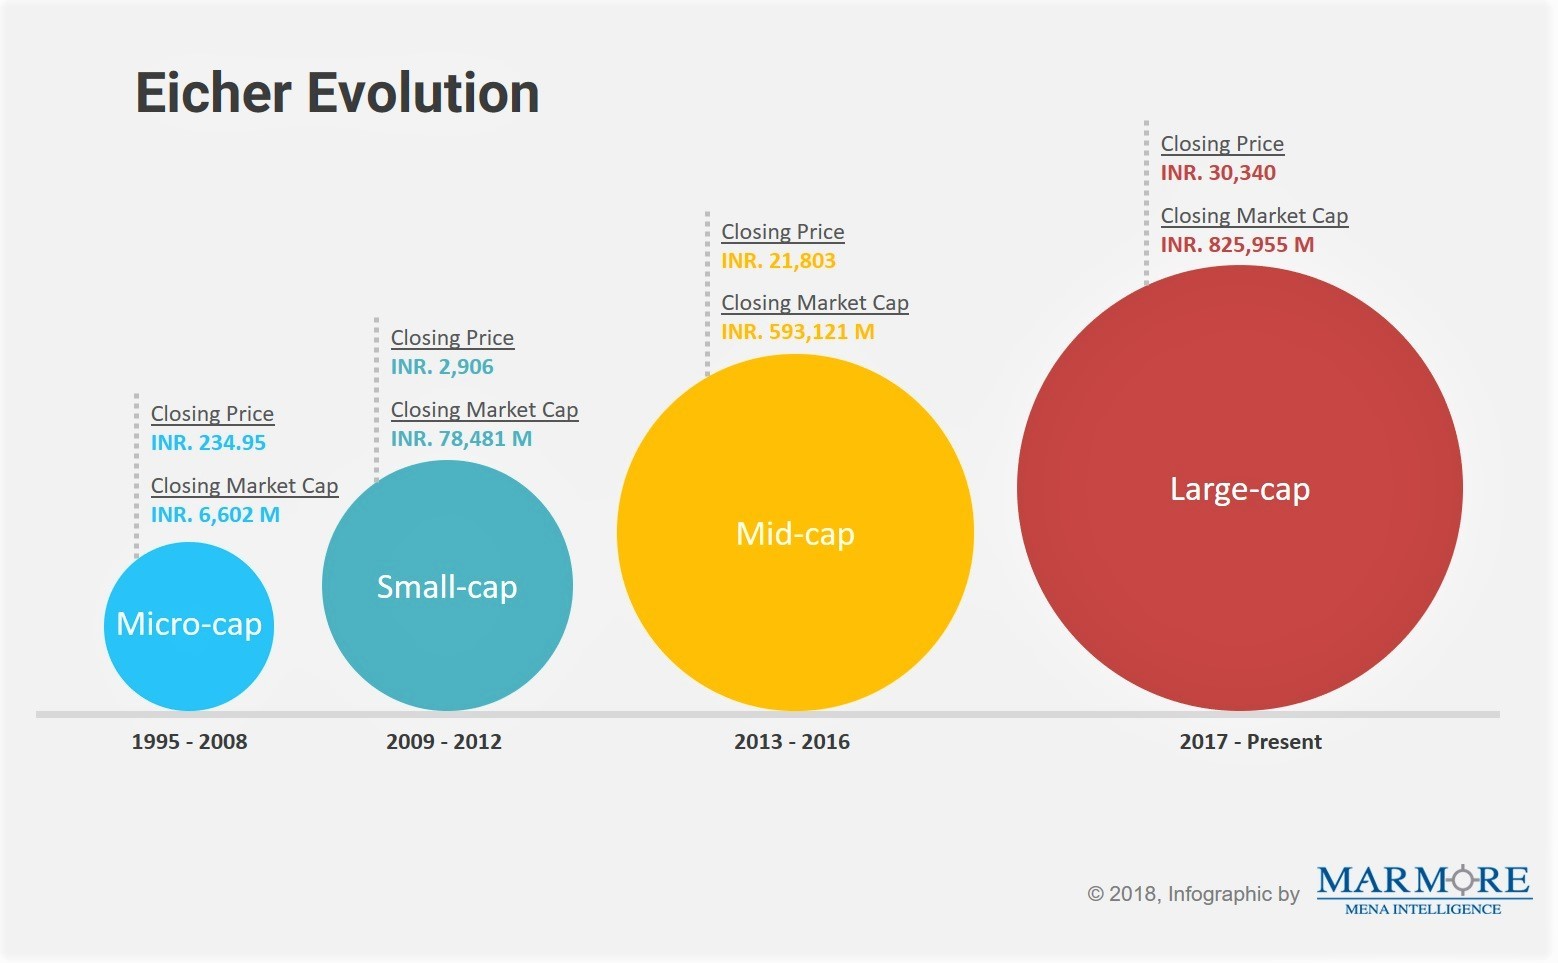
Typically, a company debuts in the stock market in the form of an Initial Public Offering (IPO) and most of the time starts the journey as a small cap or micro cap. While many will simply amber along or fall by the way side over time, some of them will grow to make it to mid-cap and eventually to large cap. A case in point is Eicher Motors whose evolution is starling over time.
Generally, equity indices are thus divided into three or four categories based on their size viz., large, medium (mid), small and very small (micro). Index providers have stringent requirements before they qualify a company in the large cap or mid cap list. These requirements range from profitability to liquidity as well as free float (% of shares available for trading).
So, if large cap companies are better in terms of size, profitability, liquidity, etc then why bother about investing in mid cap or small cap? The reason is they have different characteristics and risk profiles as profiled below.
Large caps: Typically, these companies adorn the famous indices (S&P 500, Nifty 50, Sensex) and are big in size as measured by market capitalization, turnover, liquidity and other parameters. They enjoy excellent research coverage by analysts. For eg., large cap constitute 89% of market cap in US while the same for India is 66%. Large cap companies are generally market leaders in their chosen sectors and have strong corporate governance codes and management disciplines. Due to this, they have lower risk profiles. However, most of them may be in a matured phase of growth and hence will offer returns commensurate with market.
Mid-caps: They are neither big nor small but somewhere in between. Mid caps account for 6% of market cap in US while they account for 15% in India. They may not be market leaders but they tend to be good performing companies but sparsely covered by analysts. They normally belong to fast growing sectors and enjoy reasonable levels of corporate governance. Their management styles will be heterogeneous and is normally majority held by a family or a person. Hence, the performance of these companies hinder on the strength of the person spearheading the story. Naturally, in terms of risk levels, they are subject to higher risk than large caps but with potentially higher returns.
Small caps: They constitute the bulk of the market in terms of number of companies but account for a very small share in terms of market capitalization (4% in US) with near to zero research coverage by analysts. They normally operate in the support or ancillary sectors of mid-caps and large caps. In other words, they tend to be the suppliers of components or services to other companies. Due to their small size, they have cost and margin pressures. They cannot afford strong management teams, or risk management resources resulting in poor corporate governance. Therefore, the failure rates are much higher resulting in higher risks. However, if identified correctly, they can provide oversized returns that can be unimaginable.
How to measure risks?
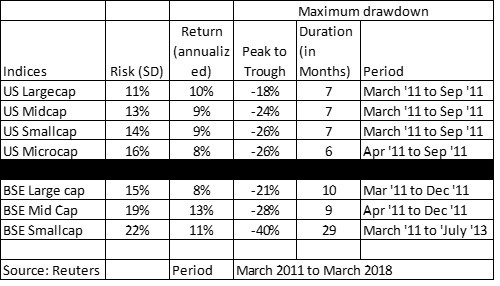
The key differentiating factor among the various size categories now boils down to their risk profiles. There are two ways to measure and understand the risk. Firstly, the standard deviation (variance of the returns) can be a good measure. The higher the standard deviation the higher the risk. For eg., the standard deviation of US micro-cap at 16% is higher than standard deviation of large cap at 11%. Secondly, risk can also be measured using drawdown statistics. Drawdown is defined as fall of an index from a peak value to a trough value. When index falls from a high, it is important to see how much it falls and how long it falls. If the fall is deep and prolonged, it is more risky. Typically, small cap drawdown will be higher and more prolonged than say large cap. For eg., between the period March 2011 to July 2013, India’s small cap index fell by a whopping 40% and this drop happened over 29 months (nearly 3 years!). Psychologically enduring and withstanding a fall of 40% over 29 months can un nerve even the calmest investor. Contrast this with India’s large cap, which experienced a drawdown of 21% between March 2011 and Dec 2011 lasting only for 9 months.
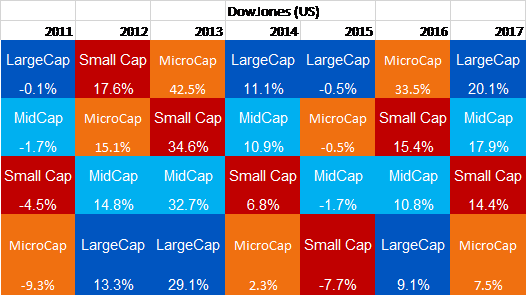
From an investment perspective, size based investment styles raise an important question: How much to allocate to each style? While for institutional investors, this will be a function of their approved asset allocation structure, for individual/retail investors this question becomes tricky. A cursory look at the year wise performance of various size based styles show the randomness of the performance. For eg., large cap in US was at the top of the table in 2011, 2014, 2015 and 2017 while it was at the bottom of the table in 2012,2013,and 2016. Hence, choosing the style based on future bets is very dangerous given the randomness.
Young investors that are at the beginning of their investment lifecycle (typically aged 25 to 30) can afford to load in favor of small cap and mid cap since they have time on hand to compound. The earlier stages of life cycle provide an opportunity to target wealth generation and hence this suggested strategy. However, investors in the middle of their investment life cycle (typically caged 40 to 50) should have equal balance between large on the one hand and mid to small on the other. Investors in the tail end of their investment cycle (typically aged above 50) should load in favor of large cap and if possible avoid mid and small cap given their high volatility. This is also because at this stage, the focus should be more on wealth preservation than wealth generation.
Happy Investing!